


- Byte Legions
- Odoo Functional
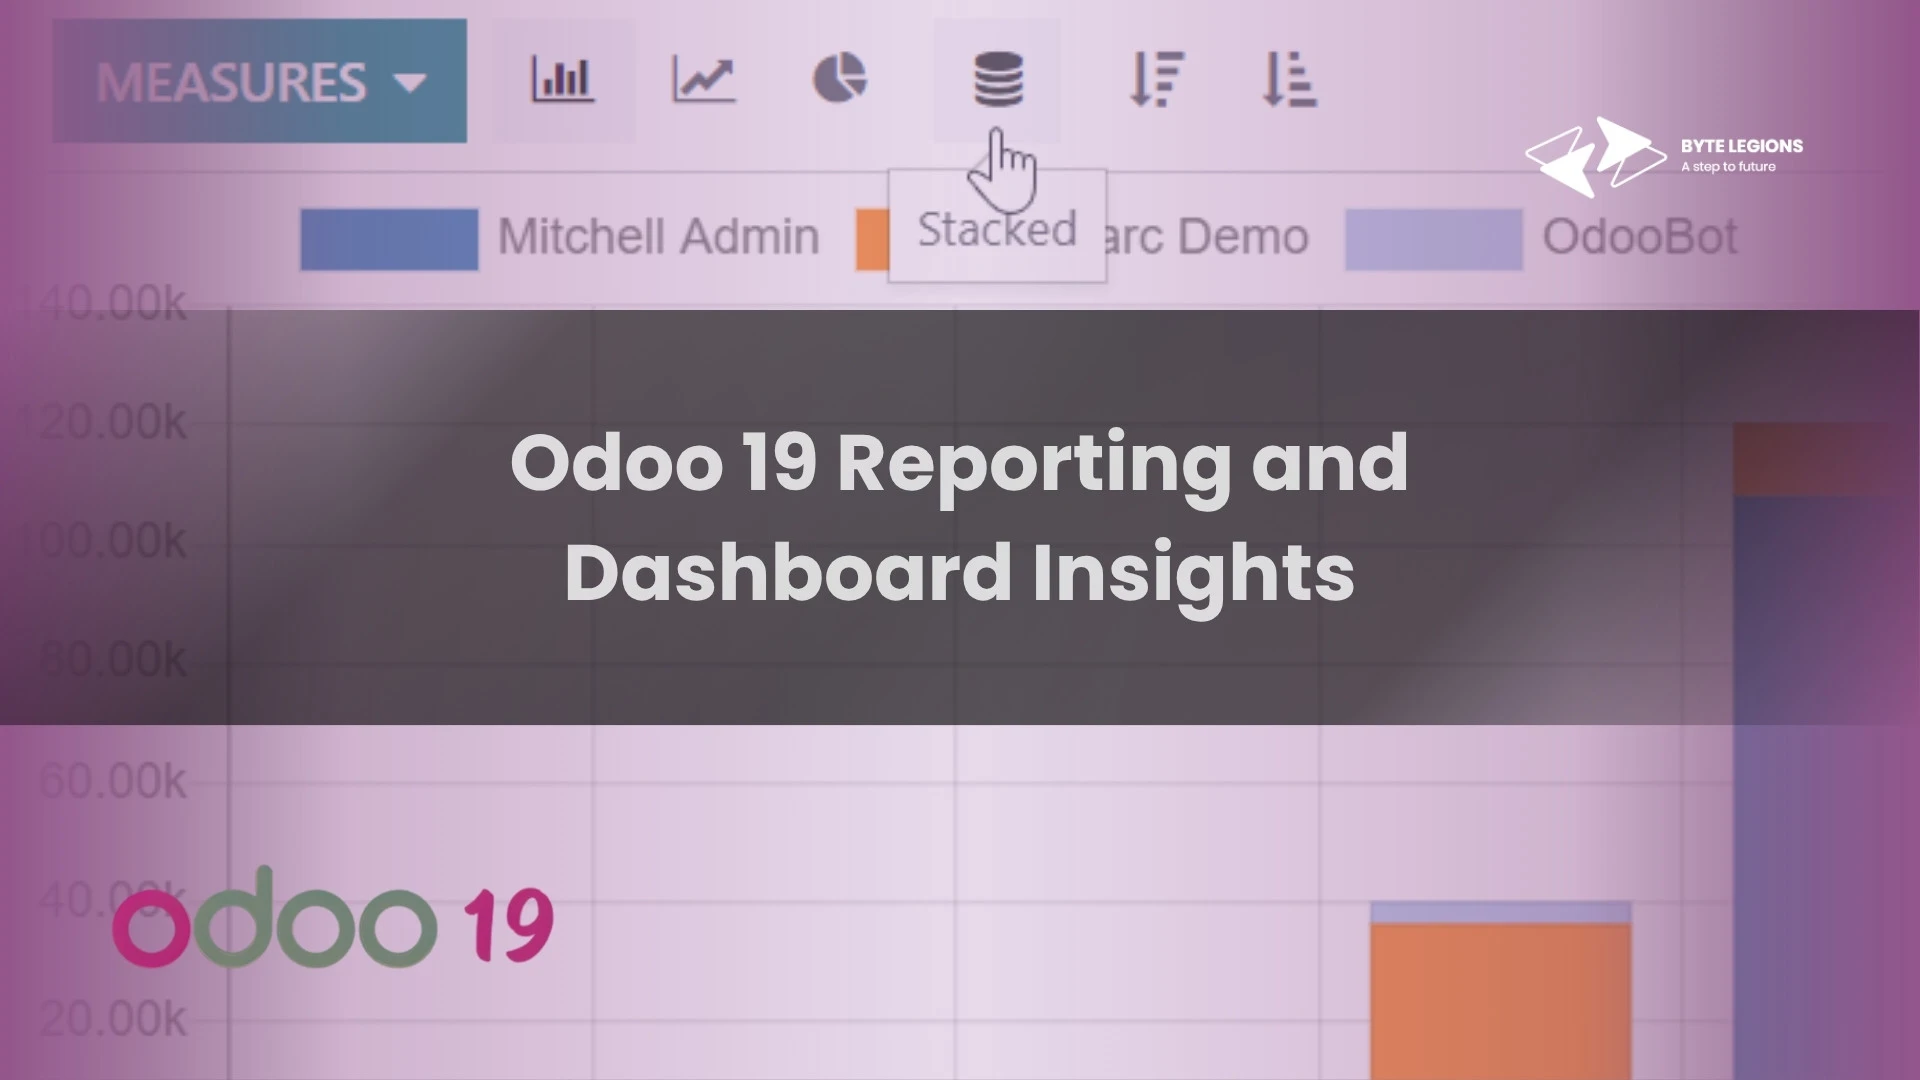
Turning Business Data into Actionable Decisions in Odoo 19
In a mature Odoo setup, reporting is not just a back office activity. It is where managers decide what needs attention now, what is improving, and what is quietly slipping. That is why Odoo business intelligence in version 19 works best when dashboards, pivot views, graphs, and spreadsheets are treated as decision tools instead of static reports. Odoo’s Dashboards app is built to centralize data from different Odoo sources in one place, display real-time information, and help users monitor key business metrics in a format that is easier to understand and act on.
Why Odoo Dashboard Reporting Matters for Daily Operations
Strong Odoo dashboard reporting gives functional teams a shared view of performance without forcing them to jump between modules. Odoo’s reporting framework across apps supports graph and pivot views, lets users choose measures, apply filters, and group data by useful dimensions such as month, team, or product. In practical terms, that means business reviews move faster because the discussion starts with visible patterns, not scattered exports and manual summaries.
Building Smarter Views with Odoo KPI Dashboard and Data Visualization
A useful Odoo KPI dashboard should answer one question clearly for each audience. Sales leaders want pipeline value, conversion speed, and expected revenue. Finance wants margin, receivables, and cash flow movement. Operations wants throughput, backlog, and exception counts. This is where Odoo data visualization matters. Graphs, cards, trend lines, and side by side comparisons turn raw numbers into patterns that managers can interpret quickly. Odoo’s dashboards are spreadsheet-based underneath, which gives functional teams a flexible structure for shaping those views without losing the live connection to business data.
How Odoo Pivot Table Analysis Improves Business Reviews
Odoo pivot table analysis is especially useful when managers need to break down one metric across several angles. Odoo’s pivot view aggregates records, allows one or more measures, and supports grouping by time or business dimensions. In reviews, this helps answer questions like which salesperson generated the most quotation value, which warehouse had the highest movement, or which period saw margin pressure. Dynamic pivot tables in Odoo spreadsheets also add flexibility because they can expand with new data and be manipulated more easily than static inserts.
Using Odoo Spreadsheet Reporting for Flexible Analysis
Odoo spreadsheet reporting is where many functional teams gain the most control. Inserted lists, charts, and pivot tables stay connected to the database and refresh with up-to-date information when the spreadsheet is opened, reloaded, or manually refreshed. This allows finance, sales, and operations users to design reporting layouts that feel familiar while still staying inside Odoo. It is also a practical way to combine dashboard visuals with commentary, action notes, and linked data sources for weekly or monthly management packs.
For a practical example from Byte Legions, read Streamlining Sales Pipelines in Odoo 19 for Enterprises, which shows how dashboard metrics such as won deals, conversion rates, deal age, and forecast trends can support leadership decisions.
Functional Use Cases for Sales, CRM, Finance, and Operations
The real strength of Odoo management reporting is that each department can work from the same system while still seeing different business signals. Instead of building separate reporting habits for every team, Odoo gives functional consultants a way to standardize measures, filters, and review routines across the organization. That creates consistency in meetings and reduces debate over whose spreadsheet is correct.
Odoo Sales Dashboard and Odoo CRM Analytics for Better Pipeline Visibility
An Odoo sales dashboard becomes most valuable when it is tied to action, not vanity metrics. Sales managers usually need pipeline value by stage, aging opportunities, conversion trends, lead source quality, and salesperson distribution. Odoo’s CRM reporting supports pipeline analysis dashboards and custom filters, which means teams can isolate time periods, exclude unassigned leads, or focus on specific quality conditions. That makes Odoo CRM analytics useful for coaching, lead allocation, and revenue planning rather than just end-of-month reporting.
Odoo Financial Reporting Dashboard for Revenue and Cash Flow Monitoring
A good Odoo financial reporting dashboard should help leadership see both performance and risk. Odoo Accounting includes real-time financial reports such as balance sheet, profit and loss, cash flow statement, executive summary, aged receivable, aged payable, and management reports like invoice analysis and budget reporting. For a functional consultant, the goal is not to expose every report on one screen. It is to choose the few views that help managers react early to margin pressure, delayed collections, or unusual cost movement.
Odoo Manufacturing KPI Reporting and Quality Analysis Reports for Process Control
In operations, Odoo manufacturing KPI reporting should focus on bottlenecks, output, stock value, and execution quality. Odoo’s inventory dashboards include operational analysis and warehouse metrics, while the Quality app supports quality checks and alerts that help teams track defects and process issues. That makes Odoo quality analysis reports especially useful for businesses that want to connect production efficiency with quality outcomes instead of reviewing them separately.
Best Practices for Odoo Custom Dashboard Filters and Interactive Reports
The biggest mistake in dashboard design is trying to show everything at once. Effective Odoo custom dashboard filters let users narrow views by date, team, branch, product, or workflow state so the dashboard stays relevant to the question being asked. Odoo also supports dynamic filtering in spreadsheets and dashboards through connected data sources and global filters, which is why Odoo interactive reports feel more useful than static exports. Functional consultants should keep layouts role-based, avoid duplicate measures, define one clear owner for each KPI, and agree on review frequency before publishing any dashboard. That is how reporting becomes part of management rhythm instead of another screen nobody trusts.
If your team needs cleaner dashboards, role-based KPIs, or better reporting flow across sales, finance, and operations, Book a Consultation to design an Odoo 19 reporting structure that supports real business decisions.
Conclusion
Reporting in Odoo 19 works best when it is designed around decisions, not just data access. With the right mix of dashboards, pivots, spreadsheets, and filters, companies can turn day to day transactions into real time business insights in Odoo that are useful for sales reviews, financial control, operational monitoring, and process improvement. The functional priority should always be clarity, consistency, and actionability. At Byte Legions, that means helping businesses shape reporting around how managers actually run the business, not around generic templates.
Frequently Asked Questions (FAQs)
1. What should I track first for Odoo performance tracking?
Start with a small set of KPIs tied to outcomes such as conversion rate, overdue receivables, stock exceptions, or order cycle time. Good Odoo performance tracking is focused and role-based rather than overloaded with every available metric.
2. Can Odoo operational analytics help managers outside finance and sales?
Yes. Odoo operational analytics is valuable for warehouse, project, service, and HR teams because Odoo provides dashboards and reporting views across apps, including logistics and team management use cases.
3. How is Odoo invoice based reporting different from Odoo sales order reporting?
Odoo invoice based reporting reflects posted billing and collection-oriented financial visibility, while Odoo sales order reporting is better for pipeline, confirmed demand, and order trend analysis before invoicing is complete. Odoo supports both finance reporting and sales analysis in their respective apps.
4. Are dashboards enough without spreadsheet support?
Usually not. Dashboards are great for fast visibility, but Odoo spreadsheet reporting adds flexibility for management packs, scenario reviews, and layout control while still staying linked to live data sources.
5. Can an Odoo predictive analytics dashboard be built in Odoo 19?
For many businesses, yes, but it usually requires thoughtful design beyond standard reporting. Odoo 19 already supports dynamic dashboards and reporting structures, and companies often extend that foundation with forecasting logic or AI-driven analysis for a more advanced Odoo predictive analytics dashboard.
Visit our Odoo blog for more insights on enhancing your Odoo experience.
Comments are closed